Published: 04/2024
The Pareto chart is a vertical bar chart that shows the frequencies at which various causes lead to an outcome. The chart was named after the Italian engineer and sociologist, Vilfredo Frederico Damaso Pareto, who used this type of chart in 19th century Italy, to display that 80% of the land was owned by
20% of the people. This led to the Pareto Principle, the concept that 80% of consequences result from 20% of the causes. In quality improvement projects, plotting information on a Pareto chart can help determine where to best direct efforts to generate improvements with the largest impact.
Advantages:
- Quantifies causes of an outcome
- Identifies where improvement efforts can be focused
- Simple statistical evaluation – Visual tool
Area of Caution:
- Does not identify the root cause of a problem
Example:
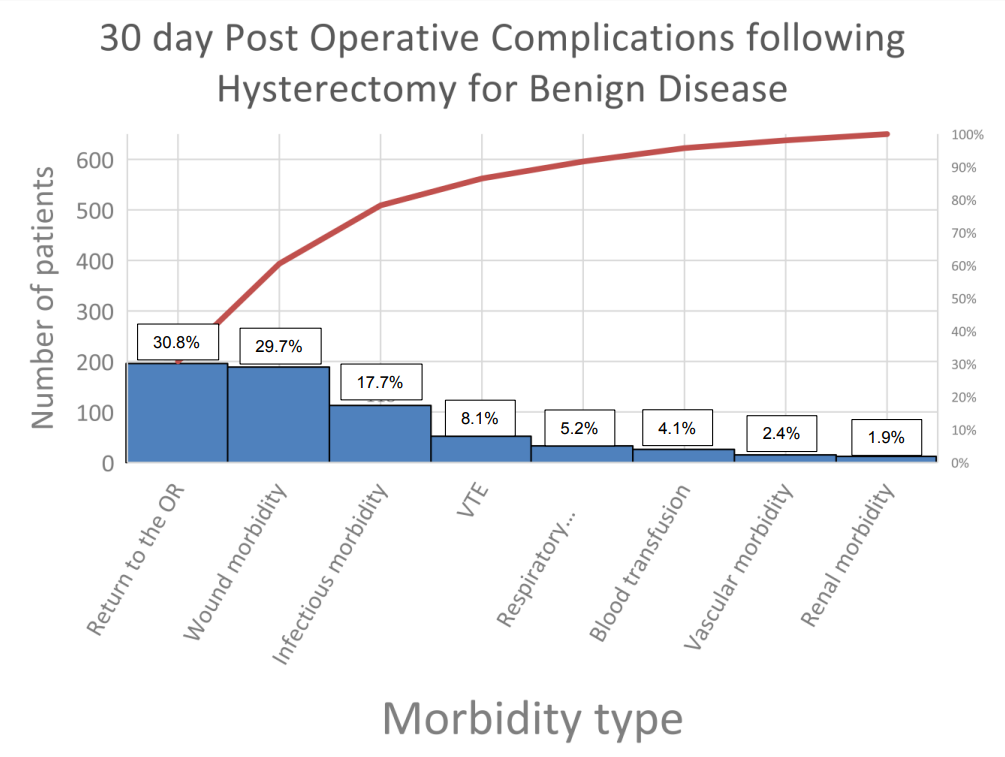
30 day Post Operative Complications following Hysterectomy for Benign Disease
| Morbidity | Patients (number) | Percentage of Total Complications (%) | Cumulative Percentage (%) |
|---|---|---|---|
| 1. Return to the OR | 196 | 30.8 | 30.8 |
| 2. Wound morbidity | 189 | 29.7 | 60.5 |
| 3. Infectious morbidity | 113 | 17.7 | 78.3 |
| 4. Venous thromboembolism | 52 | 8.1 | 86.5 |
| 5. Respiratory morbidity | 33 | 5.2 | 91.6 |
| 6. Blood transfusion | 26 | 4.1 | 95.6 |
| 7. Vascular morbidity | 15 | 2.4 | 98.1 |
| 8. Renal morbidity | 12 | 1.9 | 100 |
| Total | 636 | 100 |
Note that, when this data is entered into a Pareto chart, the various morbidities are plotted, in order of decreasing frequency, on the x-axis. The Y axis shows the number of patients. The number of patients experiencing each type of morbidity is shown by the height of the blue bar. The percentage experiencing each individual morbidity can be indicated at the top of each blue bar.
The red line shows the cumulative number of patients experiencing morbidity (left y-axis) and cumulative percentage experiencing any morbidity (scale on right y-axis).
In this data set, a total of 196 patients returned to the operating room, which accounts for 30% of the total morbidity experienced. When ‘return to the operating room,’ ‘wound morbidity’ and ‘infectious morbidity’ are combined, they account for 78.3% of all morbidity. Therefore, to reduce morbidity after benign hysterectomy, effort should be directed toward these three causes.
Further Reading:
Giardino, Angelo; Riesenberg, Lee Ann; “Basics of Quality Improvement.” Medical Quality Management: Theory and Practice, Third Edition edited by Julia Caldwell and Prathibha Varkey, Springer 2021, page 16.