Published: 05/2024
The Fishbone Diagram (also known as the Ishikawa diagram) is a cause-and-effect quality tool used for exploring potential causes of a particular outcome. The diagram can be used to guide quality improvement projects. It is best used to engage a team-based approach to problem solving and prompts the team to consider all categories of causes simultaneously. Limitations include its inability to measure the individual impact of each cause on the specific outcome.
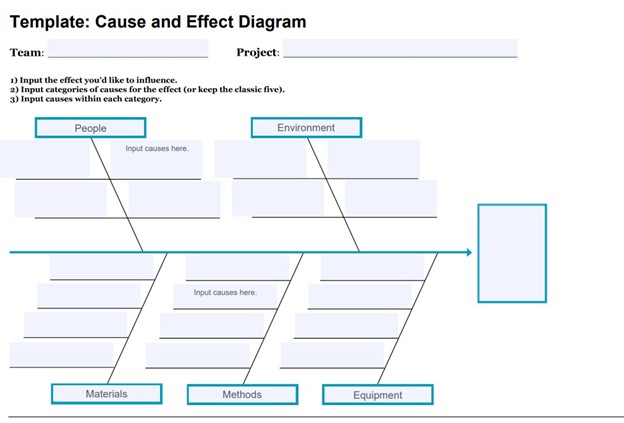
The fishbone diagram resembles the skeletal outline of a fish where the head is the problem or issue, and the spines are potential causes for the problem. Common categories include people, materials, methods, environment, and equipment.
Named after Dr. Ishikawa, a quality expert from Japan, it has been adapted to healthcare by the Institute of Healthcare Improvement.
How to construct a Fishbone Diagram1:
- Write the effect you wish to influence in a box on the right-hand side of the page. The effect is often a quality problem that needs to be solved or a goal. It may help to write out a problem statement.
- Draw a horizontal line across the page to the left, starting at the box you just drew.
- Decide on five or six categories of causes to consider. The standard categories in a classic cause and effect diagram are Materials, Methods, Equipment, Environment, and People. These can be adapted to better fit your organizational structure and/or the issue being explored.
- Draw diagonal lines above and below the horizontal line to create “fishbones,” and label each line at the end with one of the category headings you have chosen. Draw a box around each label. 5) For each category, generate a list of the causes that contribute to the problem. List the causes by drawing “branch bones.” As necessary, draw additional branch bones from the causes to show subcauses.
Tip: Develop the causes by asking “Why?” until you have reached a useful level of detail — that is, when the cause is specific enough to be able to test a change and measure its effects. The branch bones allow for a deeper evaluation of the root causes and their relationships to the effect.
A short (5 minute) instructional video may be helpful. There are a few available at this page from the
Institute of Healthcare Improvement. https://www.ihi.org/resources/tools/cause-and-effect-diagram
Reference:
1Institute for Healthcare Improvement: This free resource above as well as several other patient safety and quality improvement toolkits are available for free by submitting your name, institution and email address.
http://www.ihi.org/resources/Pages/Tools/CauseandEffectDiagram.aspx
Additional Resource:
How to Diagnose Solutions to a Quality of Care Problem. Harel A, Silver SA, McQuillan R, et al.
Clin J Am Soc Nephrol. 2016 May 6; 11(5): 901–907. Published online 2016 Mar