
Published 09/2026
The Driver Diagram is a cause-and-effect quality tool used to create a visual description of where you’re going, based upon your team’s theory for improvement. A driver diagram establishes a pictural relationship between the overall aim of a project (the ‘effect’) and the factors (‘causes,’ often called ‘drivers’) that contribute to the aim.
Drivers are further specified into primary and secondary drivers. Primary drivers are major factors that contribute directly to achieving the aim. Secondary drivers are components that can alter a primary driver. All drivers and the aim of the project must be measurable. These metrics and their definitions should be attached to the driver diagram.
A driver diagram is a useful tool when communicating the improvement strategy to a range of stakeholders. It helps focus work by defining the portion of the system being addressed and the factors contributing to the outcome of interest. Once the driver diagram is created, the project team can systematically consider change ideas and their potential impact on each secondary driver.
To create a Driver Diagram1,2:
- Start by working with the team to clearly define the project’s aim. Make certain the team includes members with a variety of perspectives to ensure that the driver diagram accurately represents a comprehensive view of the system being improved.
- Once agreement is reached, list the aim on the left side of the page.
- Brainstorm with team members to identify and specify each primary driver that affects the aim, generally between two and five total. Place the primary drivers in boxes to the right of the aim, connected by directional lines with arrows. Use solid lines to denote strong relationships and dotted lines to denote weaker relationships.
- Define the secondary drivers that influence each primary driver. There may be many of these. Place them in boxes to the right of the primary drivers and connect each secondary driver to at least one primary driver with directional lines (solid or dotted) with arrows.
- Brainstorm and refine change ideas for each secondary driver. List these to the right of the secondary drivers and use arrows (again, solid or dotted) to connect each change idea with at least one secondary driver.
- Define clear metrics for each driver and the overall aim.
Example:
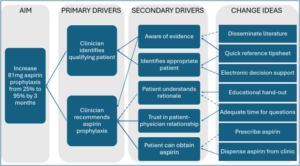
An ambulatory practice sets a goal to increase adherence from 25% to 95% for risk-driven 81mg aspirin prophylaxis within three months. They construct the below driver diagram to help them visualize their improvement strategy.
Additional Resources
- Institute for Healthcare Improvement. Driver Diagram [Internet]. Boston: Institute for Healthcare Improvement; [cited 2026 Aug 15]. Available from: Institute for Healthcare Improvement. This page includes two short videos on constructing and using a driver diagram, as well as a blank driver diagram template within the toolkit link at the bottom.
- Centers for Medicare & Medicaid Services, Center for Medicare & Medicaid Innovation. Defining and Using Aims and Drivers for Improvement: Health Care Innovations Awards – Round Two [Internet]. Baltimore: Centers for Medicare & Medicaid Services; [cited 2026 Aug 15]. Available from: Advancing States.